- forage
- landscape
- mapping
- ecology
- loudoun-county
Cartography of a Forage Radius
We drew a three-mile circle around our apiary and cataloged what is inside it. The landscape looks different when you read it as a bee.
A honeybee forages within roughly a three-mile radius of her hive. That number is an average, not a hard boundary — bees have been documented flying farther when local resources are poor, and much shorter when the forage is good.1 But three miles is the commonly cited working range, and it defines the landscape that matters to a colony.
We decided to map ours.
Drawing the Circle
A three-mile radius centered on our apiary in the Leesburg area covers approximately twenty-eight square miles. On a map, it is a clean, abstract circle. On the ground, it is anything but clean.
The exercise started with a satellite image and a compass tool. We drew the circle and then tried to catalog what was inside it — not as a real estate map, not as a zoning map, but as a forage map. A map of what a bee would care about.
The distinction matters. A road map shows you roads. A zoning map shows you what humans have permitted on each parcel. A bee’s map would show something different entirely: where the flowers are, when they bloom, how much nectar they produce, and how far the bee has to fly to reach them. Property lines are invisible. Speed limits are irrelevant. The highway median, which humans regard as dead space, might be one of the richest corridors of white clover in the radius.
We do not have a bee’s map. What we have is an approximation — built from satellite images, plant surveys, our own observations, bloom calendars, and the published literature on mid-Atlantic nectar plants. It is rough, and parts of it are certainly wrong. But the exercise of building it changed how we see the place we live.
What Is Inside the Circle
Loudoun County sits at the edge of two landscapes. To the east: suburban development — Ashburn, Brambleton, subdivisions with HOAs and ornamental landscaping. To the west of Route 15: agricultural land, horse farms, vineyards, and the foothills of the Blue Ridge.2 Our apiary sits near that boundary, which means our bees’ forage radius spans both worlds.
Here is what we found, organized not by zoning category but by what it means to a foraging bee:
The tulip poplars along North Fork Goose Creek. This is the anchor of the spring flow. Liriodendron tulipifera is a dominant canopy tree in our area, and in late April through May it produces nectar in quantities that can add five or six pounds to a hive’s weight in a single day. A single tulip poplar has been estimated to produce approximately nine pounds of nectar per season under favorable conditions.3 The stand along the creek is mature — hundred-foot trees, widely spaced — and it is the single most important feature on our bees’ map.
The residential gardens. The subdivisions to the east are, from a foraging perspective, a patchwork of opportunity. Individual gardens contain ornamentals — coneflowers, bee balm, salvias, lavender — that produce modest amounts of nectar over a long season. Research from a 2022 study found that urban honeybees preferentially targeted residential areas for foraging, and that foraging distances in suburban settings were consistently shorter than in agricultural areas — suggesting the diversity and proximity of garden plantings make them efficient forage sources.4
The agricultural fields. Within the radius there are fields planted in soy, corn, and hay. Soybeans produce some nectar and can contribute to a late-summer flow. Corn produces pollen but no nectar — it is wind-pollinated and of limited value to honeybees. Hay fields that include clover can be significant, but only if they are not cut before bloom. The timing of the mow determines whether a hay field is forage or stubble.
The highway medians and roadsides. Route 15 runs through the circle, and its mowed margins and median strips contain white clover, chicory, Queen Anne’s lace, and goldenrod depending on the season. Virginia Department of Transportation mowing schedules affect bloom availability — early mowing removes the spring flowers, while deferred mowing (which some highway districts are experimenting with) allows fuller bloom cycles. These are not large patches, but they are linear corridors that connect larger forage areas.
The abandoned orchard. There is an old apple orchard within the radius that has not been commercially managed in years. The trees still bloom in April, and they provide early-season pollen and nectar before the tulip poplars open. The understory has gone to blackberry and multiflora rose, both of which are significant nectar sources — multiflora rose in particular blooms heavily in May and June and produces a light, fragrant honey.
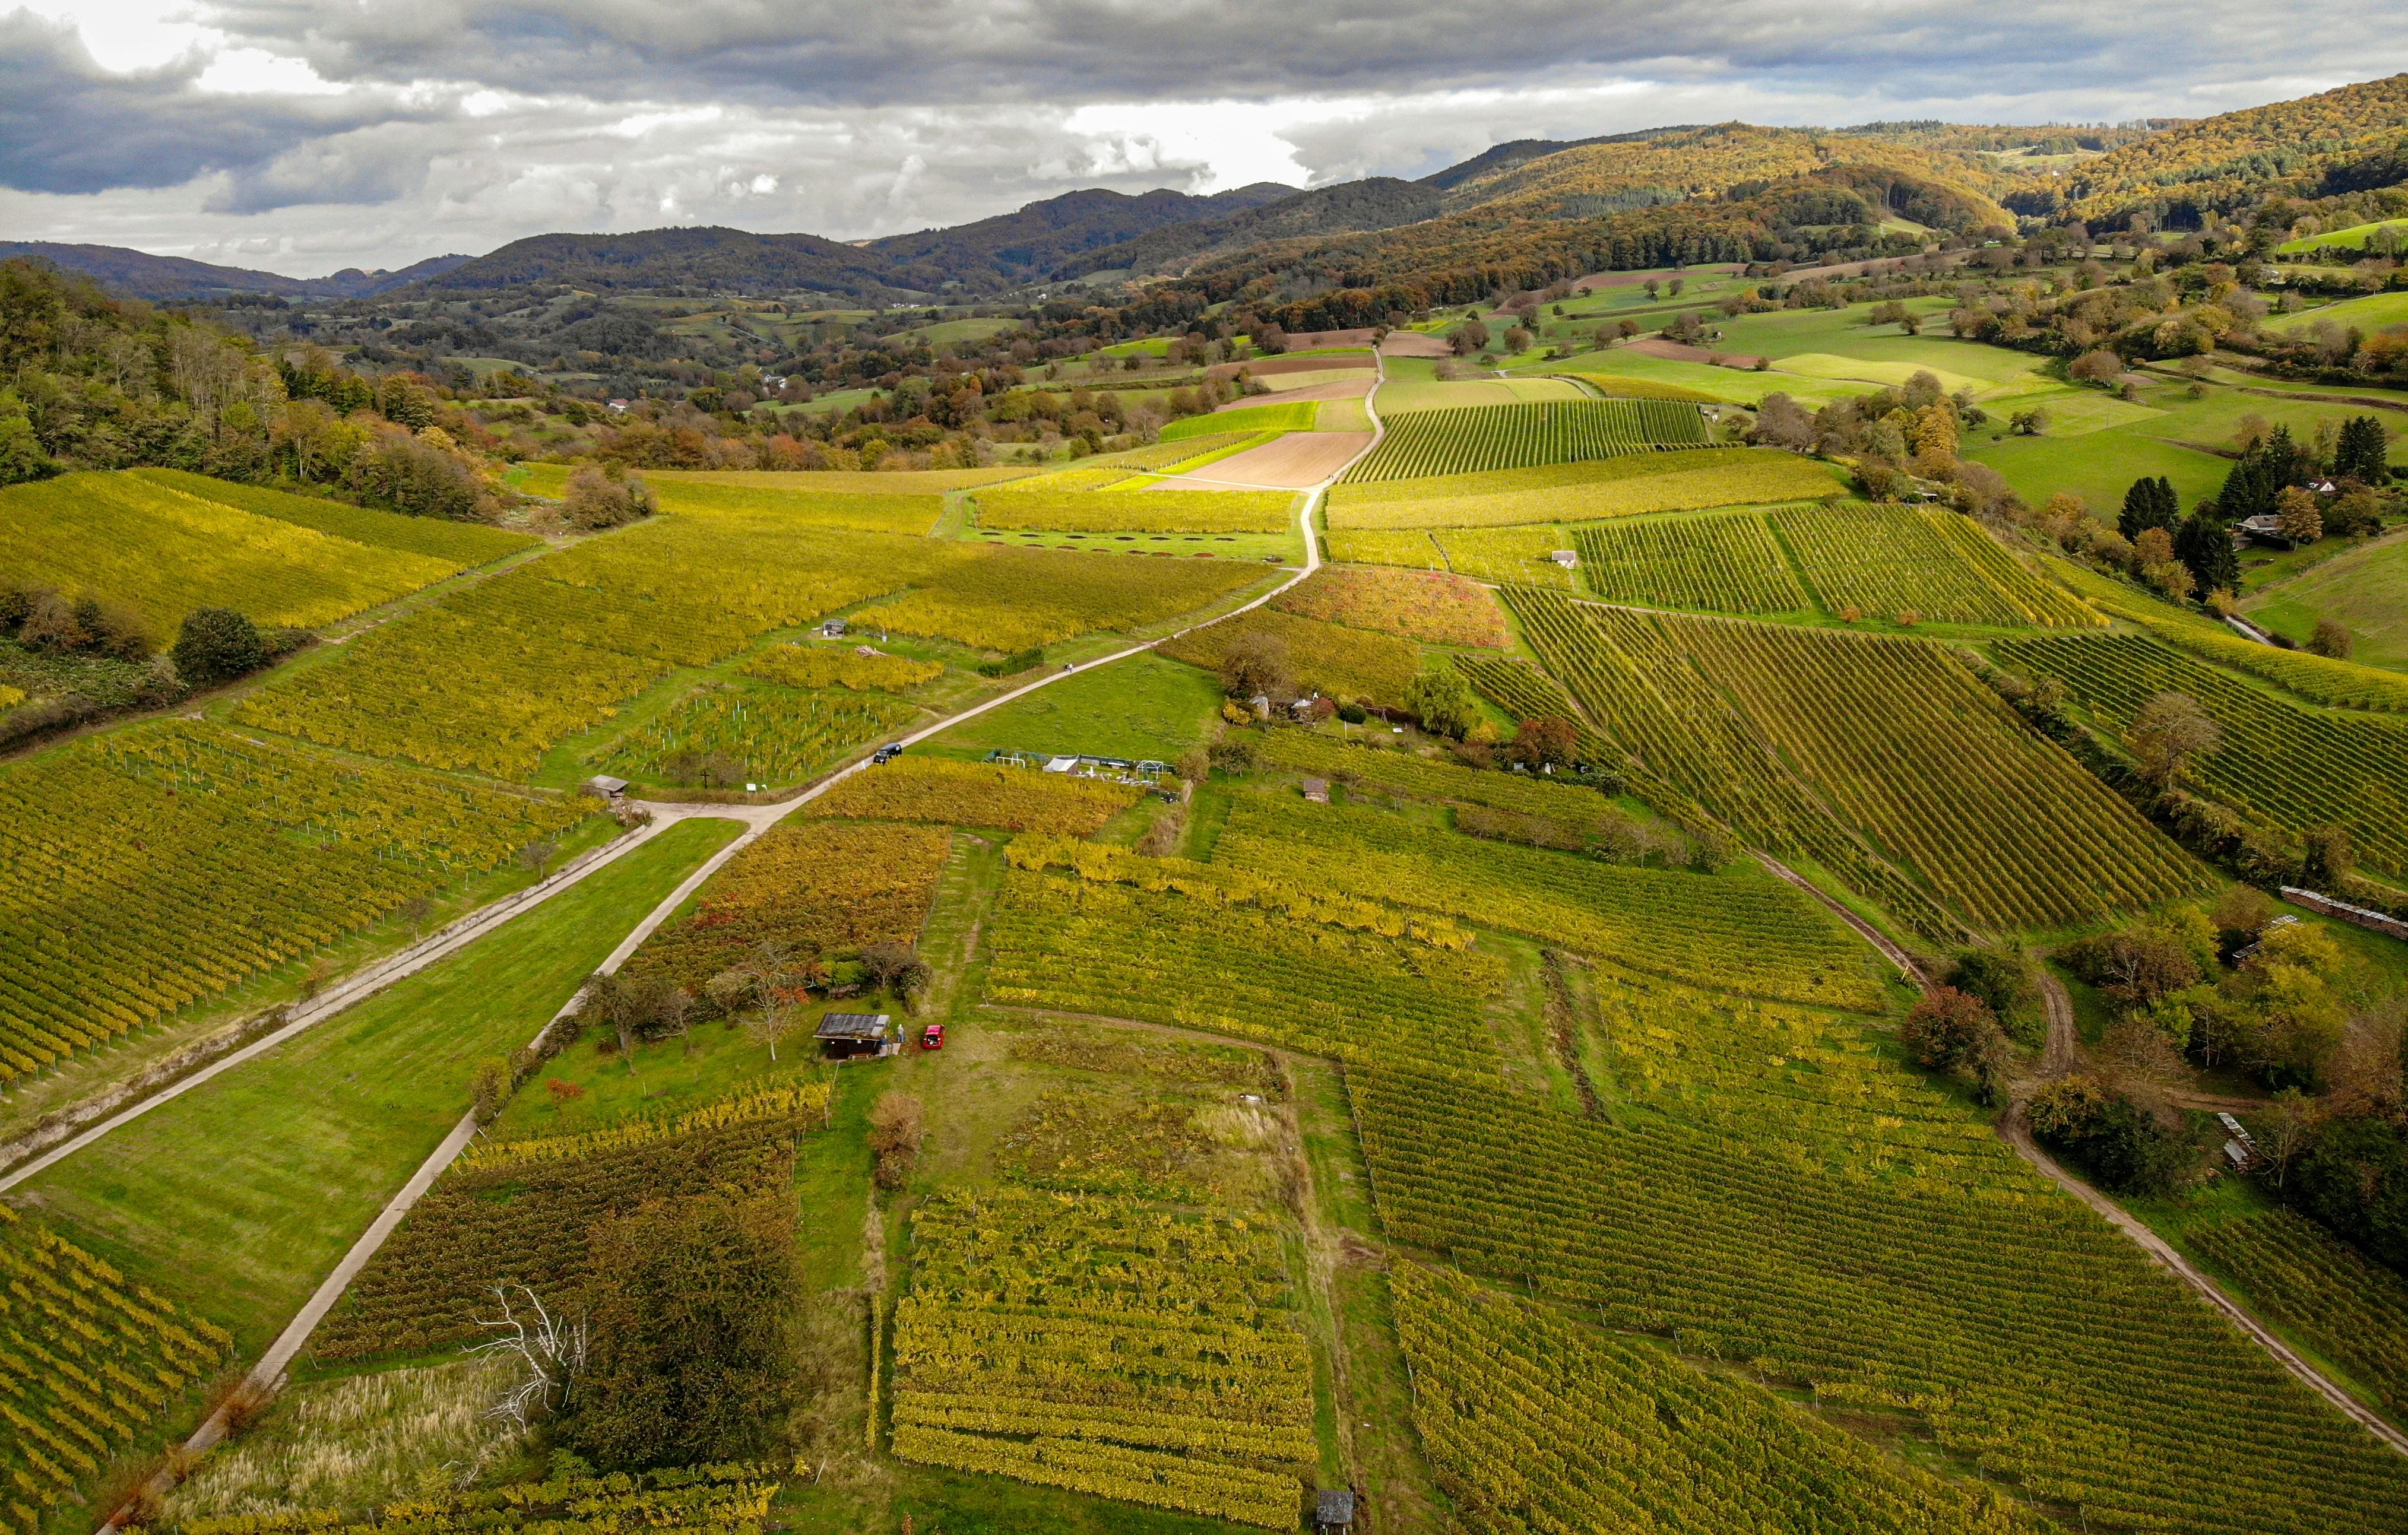
The vineyards. Western Loudoun has over forty wineries.5 Grape vines are wind-pollinated and produce no nectar of value to honeybees. But the cover crops between rows — clover, vetch, mustard — can be good forage if they are allowed to bloom before being mowed or tilled.
The parking lots. The strip mall at the edge of the radius has a parking lot island planted with Bradford pears, which bloom early and provide some pollen, and a perimeter of turf with a surprising amount of white clover — probably because nobody bothered to spray it. A gas station half a mile away has a cracked asphalt lot where dandelions have colonized every fissure. These are not picturesque forage sources. They are real ones.
The Seasonal Map
The forage map is not static. It rotates through the year like a series of overlays, each one highlighting different features of the same landscape.
March. The map lights up at the creek bottoms first. Red maple pollen, skunk cabbage, a few early dandelions in the south-facing lawns. The foraging radius is effectively tiny — the bees are not flying far in fifty-degree weather, and they do not need to. The earliest sources are close.
April. Fruit trees open — the abandoned orchard, the ornamental cherries in the subdivisions, a few remaining apple trees on the old farmsteads. Dandelions peak. The map expands as temperatures rise and flight distances increase.
Late April through May. The tulip poplars. The map collapses to a single dominant feature. When the poplars are flowing, the bees do not need to fly far — the nectar is abundant and nearby. Hive weights climb several pounds per day. This is the season the entire year is built around.
June. The poplars finish. Black locust, if it blooms (it is notoriously inconsistent), fills a brief gap. Multiflora rose and blackberry take over. The map diversifies — the bees spread out across a wider range of smaller sources.
July through August. The dearth. The map goes mostly dark. A few garden perennials, some clover if it has not been mowed, scattered wildflowers in unmowed margins. The bees draw down stored honey. Foraging effort stays high but returns diminish. This is when the parking lot clover matters.
September. Goldenrod and aster. The map brightens again across every unmowed field and road margin in the radius. The fall flow is diffuse — no single dominant source like the tulip poplars, but a widespread, low-level accumulation from dozens of species across the landscape.
October onward. The map goes dark. The bees cluster and live on stored resources until March.
What the Map Reveals
Three things became clear when we finished this exercise.
First: the bees’ landscape is not our landscape. We drive on Route 15. The bees cross it at altitude without noticing. We mow our lawn. The bees wish we would not. We see the gas station as a gas station. The bees see the dandelions in its cracks. The landscape that matters to a foraging bee is organized by bloom time, nectar yield, and distance — not by property lines, road names, or what humans have decided each parcel is for. Overlaying a bee’s priorities on a human map produces a kind of double vision — the same twenty-eight square miles, read two completely different ways.
Second: decisions made by people who do not know the bees exist determine whether the bees survive. The farmer who sprays the soybean field during bloom. The HOA that requires lawn monocultures. The highway department that mows the median in June. The vineyard that tills under its cover crop. None of these people are thinking about honeybees. All of them are shaping the forage map. A colony’s survival in August may depend on whether a landscaper three miles away decided to leave the clover or kill it.
Research on landscape composition and colony health supports this. A study published in PLOS ONE found that honey bee success — measured by colony population and weight gain — was positively correlated with the proportion of grassland and natural habitat within a three-kilometer radius and negatively correlated with intensive cropland.6 The map is the colony’s fate, and the beekeeper controls almost none of it.
Third: the forage map is getting smaller. Not in radius — the bees still fly three miles. But in content. Every new subdivision that replaces a farm field, every lawn that replaces a meadow, every clover patch that gets sprayed with broadleaf herbicide reduces the total forage available within the circle. Loudoun County has experienced dramatic population growth and suburbanization since the 1990s.7 Each new development changes the map. The bees adapt — they forage on garden flowers, parking lot weeds, and whatever survives in the margins. But the margins are getting narrower.
The Limits of This Exercise
We should be honest about what this map is and is not.
It is a rough approximation built from satellite images, plant identification guides, our own walks and drives through the area, and published bloom calendars for mid-Atlantic species. We did not use formal GIS software or conduct systematic plant transects. We did not decode waggle dances to determine where our bees are actually foraging — a method that research teams like Samuelson et al. have used to map forage preferences with precision.8
What we have is closer to a naturalist’s sketch than a scientific survey. It is useful for thinking about the landscape differently — for noticing the clover, the old orchard, the unmowed highway strip — but it is not data.
Tools like Penn State’s Beescape platform offer more systematic approaches, using satellite land-cover data to score landscape quality for pollinators within adjustable radii.9 If you want to assess your own apiary’s forage landscape with real data, that is a better starting point than a hand-drawn circle on a satellite image.
But the hand-drawn circle changed how we look at the drive to town. We notice the mowing schedules now. We notice which fields are in bloom and which were sprayed last week. We notice the parking lot dandelions. Once you start reading the landscape as a forage map, you cannot stop. Everything is either food or not-food, and the ratio keeps shifting.
References and further reading:
- Beekman, M. and Ratnieks, F. L. W. “Long-range foraging by the honey-bee, Apis mellifera L.” Functional Ecology 14, no. 4 (2000): 490-496. Documentation of foraging distances under varying landscape conditions.
- Loudoun County, Virginia, Wikipedia entry and county planning documents. Overview of the eastern suburban / western agricultural land use divide along Route 15.
- U.S. Forest Service, Silvics of North America, Liriodendron tulipifera L. Species profile including nectar production estimates and habitat range.
- Samuelson, A. E., et al. “Dancing bees evaluate central urban forage resources as superior to agricultural land.” Journal of Applied Ecology 63, no. 3 (2022). Waggle dance analysis of urban vs. agricultural foraging patterns.
- Loudoun County Department of Economic Development. County agricultural and tourism statistics including winery count.
- Sponsler, D. B. and Johnson, R. M. “Honey bee success predicted by landscape composition in Ohio, USA.” PeerJ 3 (2015): e838. Landscape-scale analysis of how land use within a foraging radius predicts colony outcomes.
- U.S. Census Bureau, Loudoun County population data. Documentation of population growth and suburbanization since 1990.
- Samuelson, A. E., et al. (2022). Methodology for translating waggle dance data into foraging distance and direction maps overlaid on GIS land-use imagery.
- Penn State Center for Pollinator Research, Beescape (beescape.org). GIS-based landscape assessment tool for pollinator habitat quality.
We sell what the bees don’t need. Interested in trying some? Drop us a line.