- monitoring
- data
- technology
- observation
- management
The Hive Scale at Three in the Morning
We put a digital scale under one hive and logged weight every fifteen minutes. The numbers told stories we did not expect.
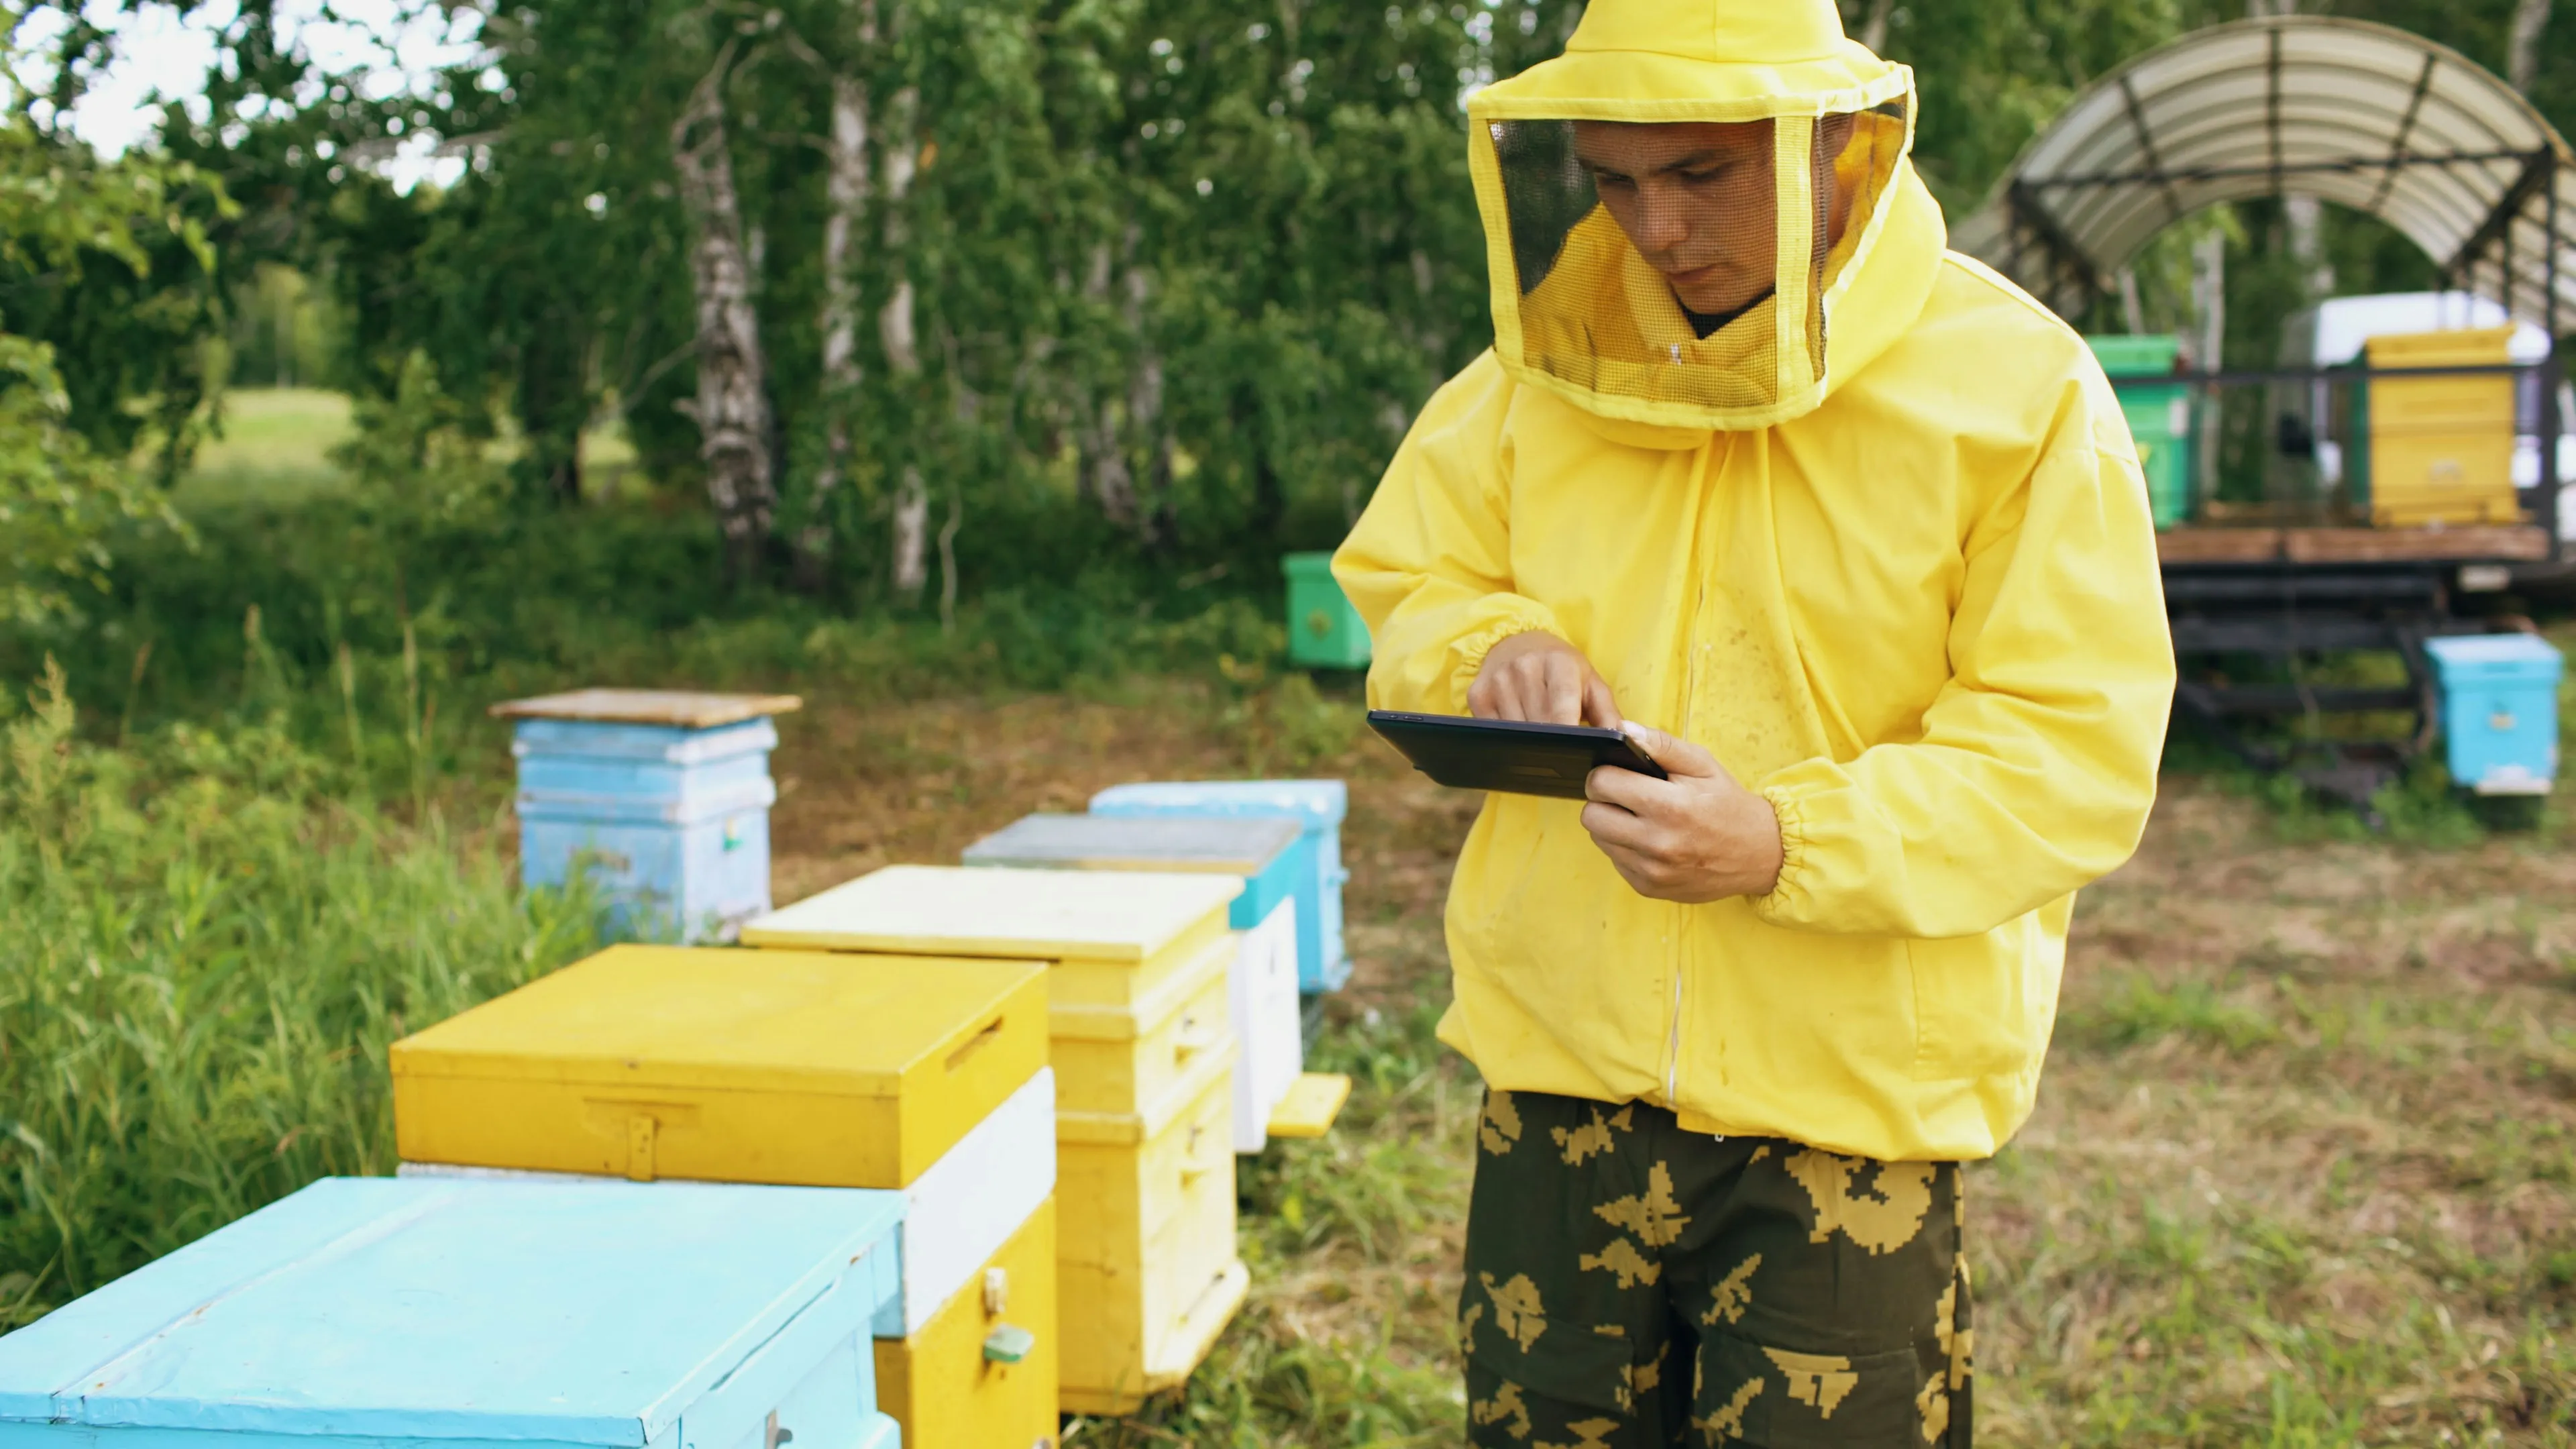
There is a particular kind of knowledge that comes from opening a hive. You see the brood pattern, count mite loads, check the queen, estimate stores. It is direct, tactile, and precise. It is also a snapshot — a single frame from a movie that runs twenty-four hours a day, seven days a week, for months on end.
We wanted to see more of the movie. So we put a scale under Hive 3.
The Setup
A hive scale is a platform that sits between the hive stand and the bottom board. It weighs the entire stack — bees, comb, honey, woodenware, everything — and logs the reading at regular intervals. Modern versions, like the BroodMinder W series, transmit data via Bluetooth or cellular to a phone or web dashboard. The hardware costs between $100 and $300 depending on the model and connectivity.1
We chose a basic Wi-Fi-enabled model that logs weight every fifteen minutes and uploads to a cloud dashboard. Installation took about ten minutes: slide the scale under the hive, level it, pair it with the app. The bees were mildly annoyed by the vibration and then ignored it.
The first week of data taught us more about what our bees do in a day than a year of weekly inspections had.
The Daily Pattern
The most immediate revelation was the daily weight curve.
At dawn — roughly 6:00 to 6:30 AM in late April — the hive weight begins to drop. This is the departure of the foraging force. Thousands of bees, each weighing roughly a tenth of a gram, leave the hive within the first hour of flyable temperatures. The aggregate weight loss is small in absolute terms — a few hundred grams — but visible on the graph as a consistent morning dip.
Through the midday hours, weight climbs. Foragers return loaded with nectar (a full crop is about 40 milligrams, roughly 40 percent of the bee’s body weight), offload to house bees, and head back out. The net effect is a steady accumulation of nectar in the comb.2
In the late afternoon, the weight gain tapers. Foraging slows as the sun drops. Then, through the evening and into the night, the weight drops again — more slowly this time. This is the curing process: house bees fan the fresh nectar with their wings, evaporating water and reducing the moisture content from roughly 80 percent down to the 18 percent required for cured honey. That water leaves the hive as vapor. It has weight. The scale registers its departure.3
By 3:00 AM, the weight has settled to a plateau. The curing bees are still working, but the rate of moisture loss has slowed. The foragers are inside. The colony is at its quietest and its lightest.
The weight at 3:00 AM, compared to the previous day’s 3:00 AM, tells you the net gain or loss for the day. This single number — the daily delta, measured at the same hour — cuts through all the noise of daytime foraging and nighttime curing and gives you a clean signal: is the colony gaining weight or losing it?
What the Nectar Flow Looks Like in Data
During the tulip poplar flow in late April and May, our scale showed daily gains of three to six pounds. The graph climbed in a smooth, steep ramp — a line that made you want to leave the hive alone and let it work.
The peak day we recorded was a net gain of 7.2 pounds in twenty-four hours. That is roughly a gallon of nectar brought in, processed, and partially cured in a single day. For a colony of maybe forty thousand bees, that number is a logistical achievement — thousands of individual round trips to the tulip poplars along North Fork Goose Creek and back, each forager carrying forty milligrams of nectar per load.
The end of the flow was equally visible. Over three days in late May, the daily gain dropped from four pounds to two pounds to zero. Then it went negative — the colony was consuming more than it was collecting. The tulip poplars were done. The graph did not require interpretation. It was a cliff.
Published research on continuous hive weight monitoring confirms this pattern. Meikle et al. (2008) documented that within-day weight variation provides a reliable measure of colony foraging activity, and that the transition from net gain to net loss marks the end of a nectar flow with more precision than any visual inspection could achieve.4
The Signatures of Events
Over months of data, certain patterns became recognizable — weight signatures that correspond to specific colony events.
Rain days show a flat line. No morning dip (foragers stay home), no midday climb (no nectar incoming), a slight overnight decline from ongoing metabolism. The scale distinguishes a rainy day from a poor foraging day with precision: on a poor day, there is still a morning dip and some midday gain, just less. On a rain day, the line is flat.
Pre-swarm plateau. In the weeks before a colony swarms, the daily weight gain may slow even during an active nectar flow. The colony is diverting resources from foraging to swarm preparation — building queen cells, gorging workers with honey in preparation for departure. We observed a three-day period where the scale showed gains of roughly half what the neighboring (unscaled) hives appeared to be bringing in, based on their activity levels. The colony swarmed on the fourth day.
The swarm itself is the most dramatic event on the graph. A reproductive swarm removes roughly half the adult bee population and the honey they have gorged in preparation for departure. On our scale, this appeared as a sudden drop of approximately four pounds in under an hour — the departure weight of perhaps fifteen to twenty thousand bees plus the honey in their crops. Published data corroborates this: swarm departures register as abrupt, time-stamped weight losses that are unmistakable in the data.5
Robbing events show a different signature. During the late-summer dearth, a weak colony being robbed by a stronger one shows erratic weight loss — not the smooth, predictable decline of normal consumption, but sudden drops during peak daytime hours when the robbers are active. We did not observe this on our scaled hive, but BroodMinder’s published case studies document the pattern clearly.6
Winter consumption is the longest narrative arc on the graph. From November through March, the colony is consuming stored honey without replenishing it. The weight declines slowly and steadily — roughly one to two pounds per week in a healthy colony during mild weather, more during prolonged cold when the cluster burns more energy for thermoregulation. The slope of this line tells you whether the colony’s stores will last until the first spring forage. Simple arithmetic: current weight minus the weight of the empty equipment, divided by the weekly consumption rate, equals the number of weeks of stores remaining.
What the Numbers Do Not Tell You
The scale told us that something was happening. It rarely told us why.
The pre-swarm plateau looked, in real time, like a slowdown in foraging. We wondered if the bees were sick, or if the flow was faltering. We opened the hive for a routine inspection and found swarm cells — but if we had relied on the scale alone, we would have been uncertain. A plateau can mean swarm preparation. It can also mean a rainy stretch, a shift in nectar sources, a queen issue, or a dozen other things.
The daily weight gain during the flow was exhilarating to watch. But it told us nothing about varroa load, brood health, or queen status. A colony can be gaining six pounds a day and also carrying a mite count that will collapse it in October. The scale measures mass. It does not measure health.
Research on next-generation colony monitoring acknowledges this explicitly. A 2024 review in Apidologie notes that while continuous weight data is among the most informative single measurements available for remote colony assessment, it requires interpretation in context — ideally supplemented by temperature, humidity, and acoustic sensors, and always validated by periodic physical inspection.7
The Three AM Question
We still check the graph at odd hours. There is something compelling about pulling up the dashboard at 3:00 AM during a snowstorm and seeing the weight line — flat, steady, the colony consuming its stores at the predicted rate, alive inside a wooden box in the dark.
You know the weight — nothing more. Something is in there, and it is metabolizing.
The scale at three in the morning gives you a number. What you do with that number is still beekeeping.
References and further reading:
- BroodMinder product documentation (broodminder.com). Hardware specifications, pricing, and data platform for continuous hive weight, temperature, and humidity monitoring.
- Winston, M. L. The Biology of the Honey Bee. Harvard University Press, 1987. Standard reference on forager crop capacity, colony population dynamics, and nectar processing mechanics.
- Seeley, T. D. The Wisdom of the Hive. Harvard University Press, 1995. Detailed account of the nectar processing and curing workflow inside a colony, including the labor allocation between foragers and house bees.
- Meikle, W. G., Holst, N., et al. “Within-day variation in continuous hive weight data as a measure of honey bee colony activity.” Apidologie 39, no. 6 (2008): 694-707. Foundational research on interpreting high-resolution weight data as a proxy for colony foraging activity.
- SolutionBee and BroodMinder published case studies documenting swarm departure weight signatures in continuous monitoring data.
- BroodMinder community data and case studies on robbing event detection through weight anomaly patterns.
- Rückriem, S., et al. “Next-generation colony weight monitoring: a review and prospectus.” Apidologie (2024). Comprehensive review of what continuous weight monitoring can and cannot reveal about colony health, with recommendations for multi-sensor integration.
We sell what the bees don’t need. Interested in trying some? Drop us a line.